
Zik
Comprehensive Case Status Dashboard
Overview
Background
When the system was first launched, the focus of the MVP was on enabling investigators to input and manage data. As part of the MVP limitations, the main dashboard was not specified, leaving its development for later stages.

Problem
The head of the Investigations and Intelligence Division, the project’s
primary stakeholder, identified a clear need: to surface actionable insights from investigation cases, highlight critical data, and provide statistics that would improve both individual and organizational performance.
Solution
Design interactive dashboard to serve as a daily operational tool for investigators, officers, and leadership.
Research
Research Methdology
-
Preliminary survey distributed to investigators nationwide to capture initial needs
-
Individual & group interviews
-
Data analysis of investigation records
The Survey
the main question was which types of information about their investigation cases are most valuable to them. The survey included a predefined list of potential data points that had been developed together with the client and a core group of senior investigators who guided the process. At the same time, investigators were encouraged to add their own ideas, ensuring the insights captured reflected both predefined assumptions and their real on-the-ground needs.
Insights From Survey

Yearly investigation count
highlighting the importance of tracking pending events requiring their attention
Watch removed fire incidents with reasons
Strong need emerged for segmentation of investigation outcomes to enable
training, process improvements, and trend detection
Overview of each investigator’s station-level cases (open vs. closed),
creating transparency among investigators and supporting investigation
officers situational awareness.
The Interviews
Following the survey, I translated the findings into quick wireframes to visualize potential directions. Based on their survey responses
I selected a group of investigators and invited them to individual and group interviews. These sessions allowed us to dive deeper into their needs and validate the first design concepts together.

Insights From Interviews
I had already designed a basic dashboard screen showing case status KPIs. During interviews, users consistently highlighted that they valued these KPIs and wanted them preserved in the full dashboard
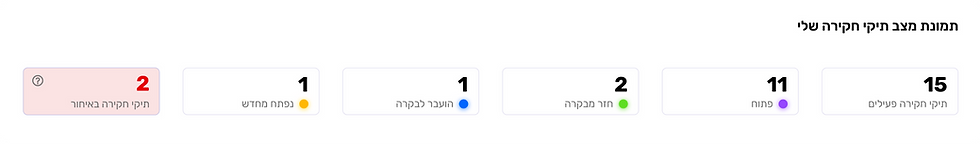
Users emphasized the importance of having visibility at three levels: personal, station-wide, and regional.

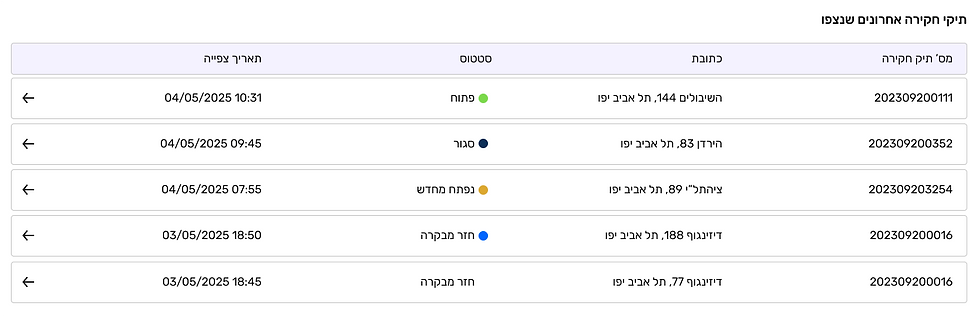
The investigators wanted a quick way to access the cases they
had last viewed - so I added table with "the last cases".
Data Analysis
Revealed a major gap – a large number of cases requiring investigation were left unaddressed (neither opened as cases nor removed from
the queue).
This directly aligned with a request from the Head of Investigations and Intelligence, who emphasized the need for a dashboard feature showing the number of events each investigator had already addressed compared to those still pending. The goal was to prevent cases from being overlooked or lost in the process.
Design interactive dashboard
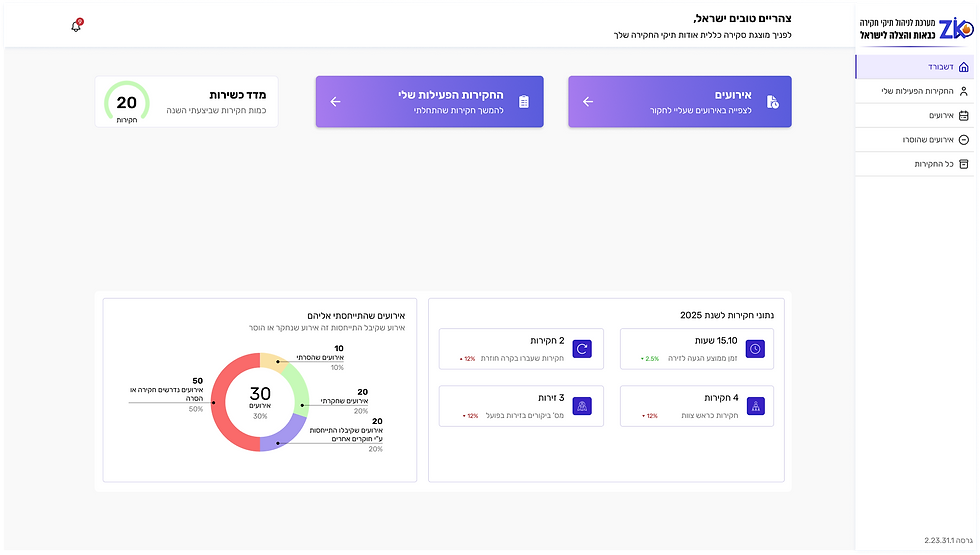
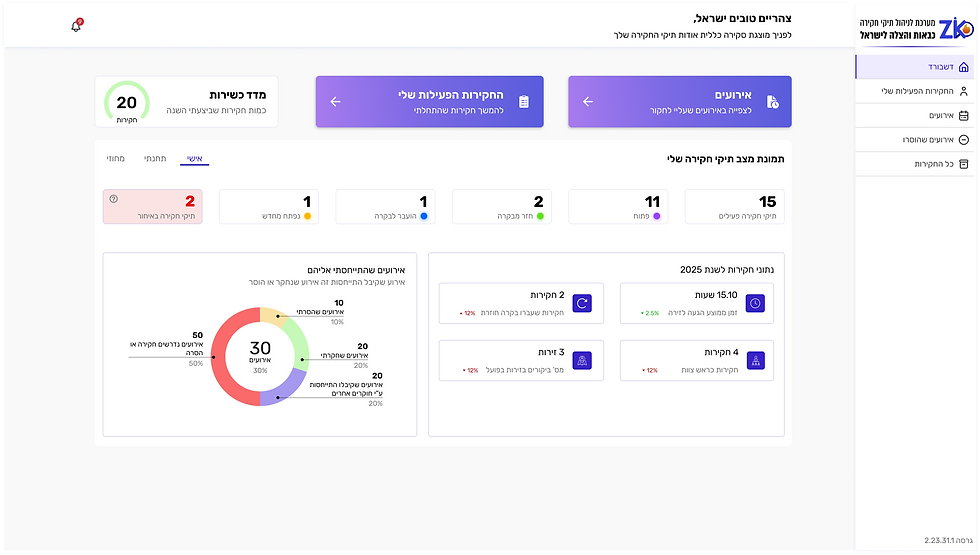
Personal View
In the personal dashboard, investigators can view their individual parameters, personal statistics, and the cases they recently accessed.

Station- Wide View
In the station dashboard, each investigator assigned to the station can view general data about other investigators, the status of investigation cases at the station, and more. This is designed to foster a sense of “being part of” the team and to encourage collective responsibility.
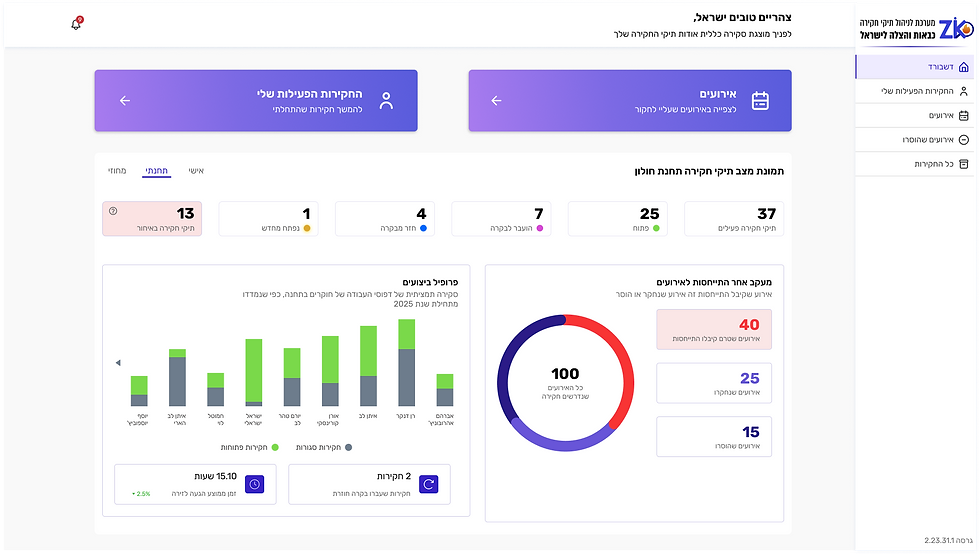
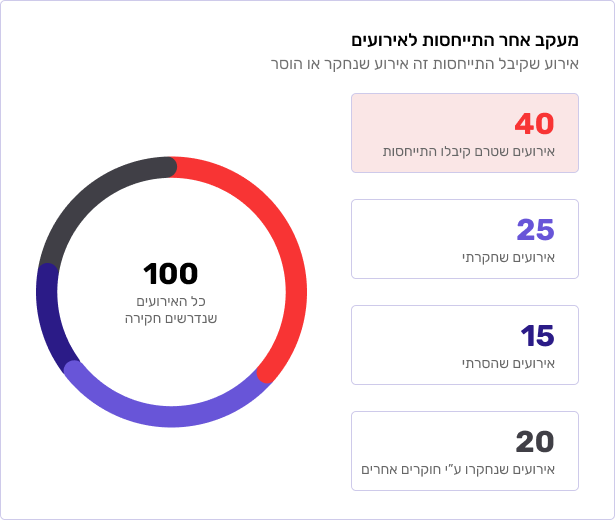
Event Response Tracking
Research revealed a lack of visibility into how investigation events were being handled across stations, resulting in events that required attention remaining unaddressed. This visualization provides an at-a-glance overview of all station events, including investigated events, removed events, and events handled by other investigators, helping improve transparency and accountability.
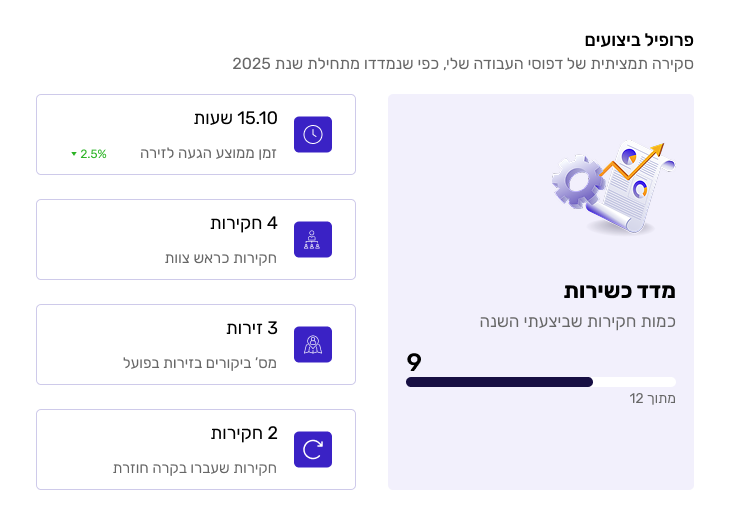
Performance Profile
To help investigators better understand their performance, I designed a personal overview that consolidates key investigation metrics in one place. At its center is the Fitness Score, which tracks progress toward the national requirement of 12 investigations per calendar year, providing a clear and actionable snapshot of their current status.
Interactive Event Response Chart
The interactive pie chart provides a deeper overview of the situation while avoiding information overload on the same screen.

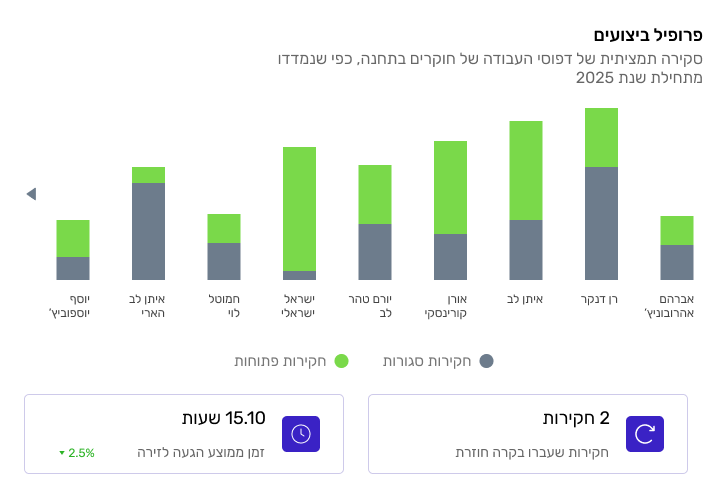
Station Performance Overview
While investigators primarily focus on their own cases, research revealed a need for greater visibility into station-wide activity. This view provides a shared performance snapshot, displaying open and closed investigations across the team. By making performance more transparent, it encourages ownership, strengthens team engagement, and helps investigators understand their role within the station's overall efforts.
Early Outcomes
The dashboard has not yet been deployed, but it was tested with investigators in usability sessions-
Users expressed high satisfaction with the solution, Many noted that the data presented was exactly what they were missing in their daily work and requested immediate access to the dashboard on their personal workstations.
Based on their feedback, the dashboard is
expected to:
-
Increase transparency and situational awareness.
-
Reduce the number of overlooked cases.
-
Strengthen accountability both individually and collectively at the station level.
Key Learnings
-
Group interviews created unexpected value participants built on one another’s insights and uncovered professional needs collaboratively.
-
Rapid prototyping and feedback loops allowed me to iterate quickly and refine the dashboard to meet users real-world workflows.
-
Providing multi-level visibility (personal, station, regional) ensures relevance across organizational layers.
-
Importantly, I learned that even basic MVP features, like case status KPIs, can carry high user value and should not be discarded, but rather integrated and expanded upon.